Google sheets is free, easy to use, and open up great opportunities for students to learn math and science in a real world context. From gaining a statistical understanding in math, to organizing and visualizing data in science, there are many possibilities! But have you ever considered that students could also collect and analyze data from their coding projects?
Connecting a coding platform to Google Sheets is easier than you might think, and it creates an engaging, interactive experience. For example, students can:
- Collect game data to create a game stats dashboard
- Run interactive surveys with a centralized results sheet
- And much more!
This tutorial will guide you through connecting coding data from mBlock to Google Sheets.
Prerequisites
Before we begin, you will need:
- A computer
- A Google account
- Access to mBlock coding platform
- A basic familiarity with Block code like Scratch
Step-by-Step Guide
Step 1: Access the mBlock Environment
Open mBlock on your desktop and navigate to the Sprites tab. This is where we’ll build our data collection program.

Step 2: Add the Google Sheets Extension
- Click on the Extensions button in the bottom right corner


- Search for “Google Sheets” in the available extensions
- Click Add to install the Google Sheets extension to your project
The Input Block
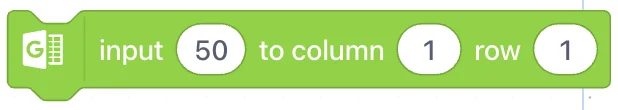
In the Google Sheets tab, you will now see 3 new blocks. The one shown above is very important for sending data into google sheets. This is how it works:
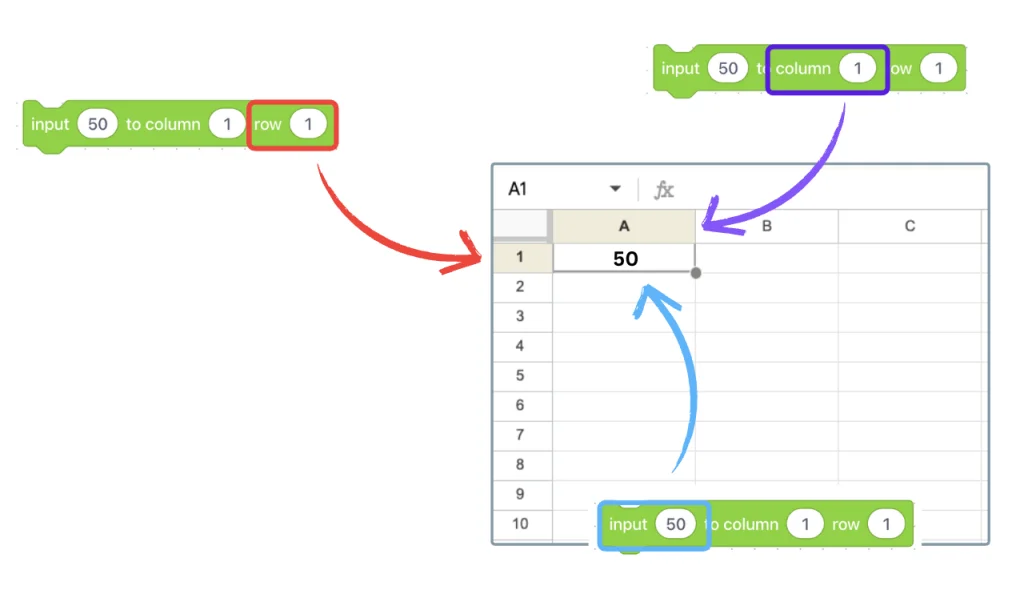
- The column is a number that matches the alphabet position. It tells the program which horizontal space to add the information into. 1=A, 2=B, 3=C, etc. (Tip: Although Google sheets does not allow you to change the alphabetical header to numerical, you can label in the first row for each column 1, 2, 3… so that it is easier to identify)
- The row is a number that references which vertical space to add the information.
- The input is the information itself. This can be a number, words, or variable values.
Step 3: Create Your Data Collection Code

Let’s build a simple program using the Google Sheets blocks. The basic structure will include:
- A “when green flag clicked” event block to start the program.
- Shared sheet block to connect your Google sheet file (we will replace the link in the next step).
- Input blocks for adding information into the sheet.
Step 4: Set Up Your Google Sheet
- Open Google Drive in your web browser
- Click New → Google Sheets → Blank spreadsheet
- Name your spreadsheet something descriptive (e.g., “mBlock Data Collection”)
Step 5: Configure Sheet Sharing
- In your Google Sheet, click File → Share → Share with others
- Important: Change the General Access setting to “Anyone with the link can edit”
- Click Copy link to get your shareable URL


Step 6: Connect Your Code to Your Sheet
- Return to your mBlock project
- Find the Google Sheets connection block in your code
- Delete the placeholder link and paste your Google Sheets URL
- Ensure your code specifies the correct cell ranges or columns for data entry. Can you guess where it will go?

Step 7: Test
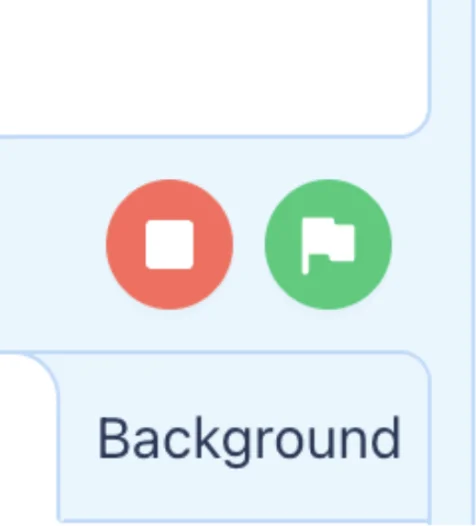
Click the Green flag in mBlock to run your program. Watch as your code executes and data appears in your Google Sheet in real-time!
Quick Troubleshooting
Data not appearing?
- Check your Google Sheet sharing permissions (anyone with link can edit)
- Verify your sheet URL is correct in the connection block
- Make sure you’re connected to the internet
🎉 You did it!
Congratulations! You’ve successfully connected coding data to Google Sheets. This opens up lots of creative possibilities!
What’s Next?
- Track sprite interactions or game stats to visualize player behavior in a dashboard
- Collect survey responses or student input automatically
- Using Google Sheets functions like
=COUNTA()and=COUNTIF() - Creating charts to see patterns in your data
Naturally, these projects will build on math concepts such as averages and probabilities.
Want more hands-on STEM resources? Check out our professional development workshops or curriculum packages for turn-key classroom solutions.